
Deals of the Week | New Orleans
Breaking down cash flow, cap rates, and risk

Rather than guessing or relying on listing pro formas, I analyze these deals using my own deal analyzer built around 20% down financing, today’s tax rates, and elevated insurance costs. These are realistic projections meant to answer one question: does this deal still work once everything is accounted for?
As always, numbers will vary by financing and management style—this is meant to be a starting point, not a guarantee.

🏘️ 3330 Seine St · $362,500
4 Units · Total Rent: $5,475 / mo
Why this is a deal:
Clean 4-plex with strong rent coverage and nearly $1,000/month cash flow. Hits the sweet spot for small multifamily buyers looking for dependable income without heavy lift.
Cap Rate: 8.98%
Cash on Cash Return: 11.69%
Monthly Cash Flow: $918
Break-Even Occupancy: 78.22%

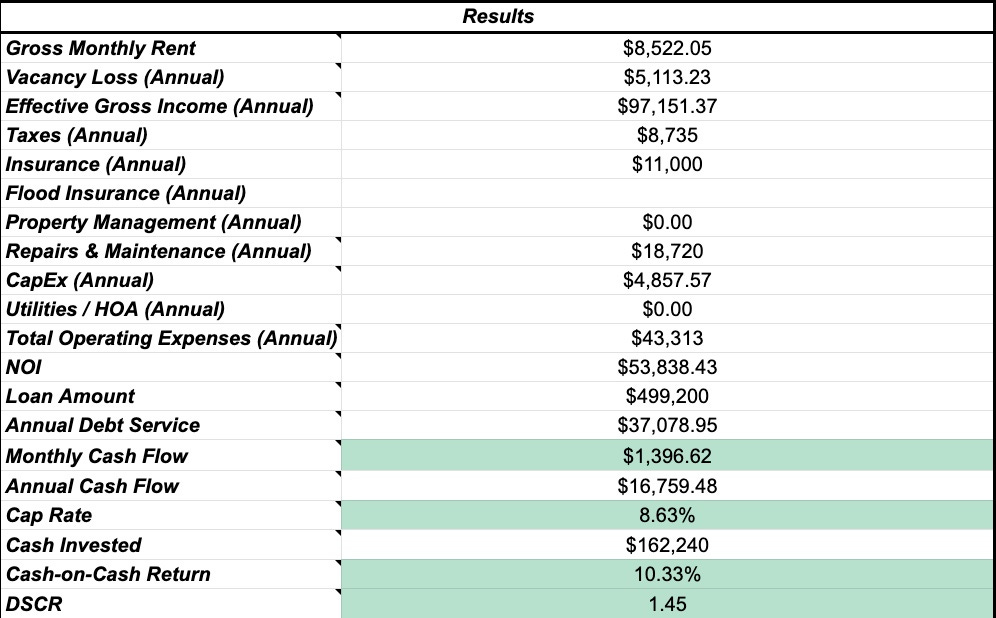
🏘️ 2714 N Galvez St · $624,000
6 Units · Total Rent: $8,522 / mo
Why this is a deal:
Strong in-place income on a 6-unit asset with solid DSCR and stable cash flow. Works well for an investor prioritizing scale and income durability over appreciation plays.
Cap Rate: 8.63%
Cash on Cash Return: 10.33%
Monthly Cash Flow: $1,396
Break-Even Occupancy: 78.61%
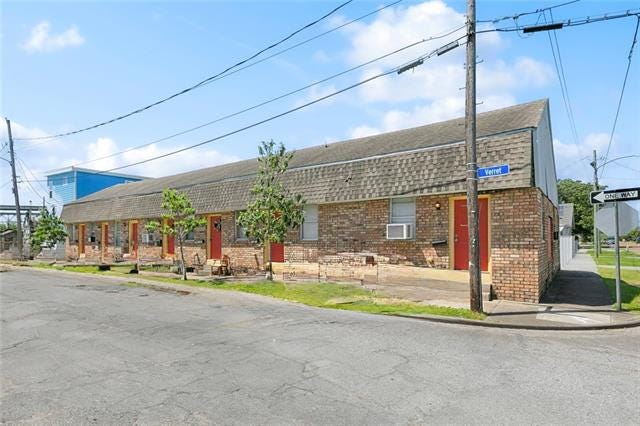
🏘️ 1101–1115 Verret St · $390,000
7 Units · Total Rent: $6,000 / mo · Off Market!
Why this is a deal:
High-unit-count asset at an accessible price point with strong cash flow and excellent coverage. Even with conservative insurance and tax assumptions, this deal produces meaningful monthly income and offers downside protection through diversified unit count.
Cap Rate: 10.17%
Cash on Cash Return: 16.25%
Monthly Cash Flow: $1,373
Break-Even Occupancy: 72.11%
If it makes sense, I’m happy to keep running deals like this based on what you’d want to see more of just reply with a price range or unit count.